
Introduction to Pandas
Introduction-to-Pandas
A guide of Pandas - The Python library for data manipulation and analysis
- Section 1 - About Pandas
- Section 2 - Importing Data
- Section 3 - Inspecting Data
- Section 4 - Sorting Data
- Section 5 - Subsetting Data
- Section 6 - Modifying DataFrames
- Section 7 - Aggregates
- Section 8 - Multiple DataFrames
Section 1 - About Pandas
For this introduction I will be using the population age structure as a dataset. The dataset was created in 2018 and contains the estimated population age structure in thousands in 5 year increments. Please see below:

Section 2 - Importing Data
To access the data you first need to import pandas and load in the csv file to a DataFrame.
import pandas as pd

df = pd.read_csv("datafeed/population_age_structure_uk.csv")
Section 3 - Inspecting Data
From there, there are various inspections that can be done to explore the dataset and see what it contains.
| Function | Description |
|---|---|
| .head(x) | Returns the first x rows of the DataFrame. Defaults as 5 rows |
| .info() | Displays information for each column (data type and number of missing values). |
| .shape | Returns the number of rows and columns of the DataFrame. |
| .describe() | Calculates a few summary statistics for each column (count and unique values). |
| .values | Used to get a Numpy representation of the DataFrame. |
| .columns | Returns the column labels of the DataFrame. |
| .index | Return the index information of the DataFrame. |
The results with the polulation age structure can be seen below:
Head
import pandas as pd

df = pd.read_csv("datafeed/population_age_structure_uk.csv")
print(df.head())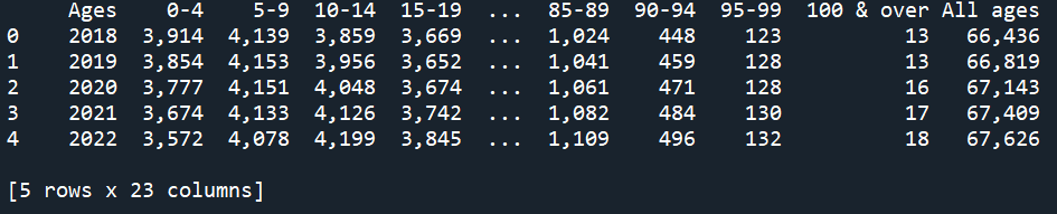
import pandas as pd

df = pd.read_csv("datafeed/population_age_structure_uk.csv")
print(df.head(3))
Info
import pandas as pd

df = pd.read_csv("datafeed/population_age_structure_uk.csv")
print(df.info())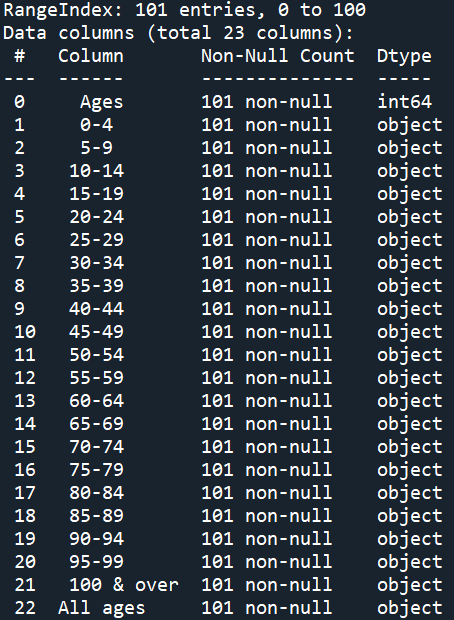
Shape
import pandas as pd

df = pd.read_csv("datafeed/population_age_structure_uk.csv")
print(df.shape)
Describe
import pandas as pd

df = pd.read_csv("datafeed/population_age_structure_uk.csv")
print(df.describe())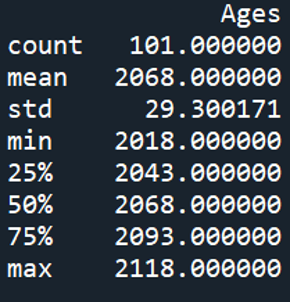
Values
import pandas as pd

df = pd.read_csv("datafeed/population_age_structure_uk.csv")
print(df.values)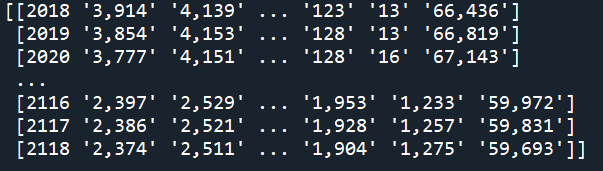
Columns
import pandas as pd

df = pd.read_csv("datafeed/population_age_structure_uk.csv")
print(df.columns)
Index
import pandas as pd

df = pd.read_csv("datafeed/population_age_structure_uk.csv")
print(df.index)
Section 4 - Sorting Data
Ascending
You can sort columns by their values ising the sort_values() function.:
import pandas as pd

df = pd.read_csv("datafeed/population_age_structure_uk.csv")
df = df.sort_values("All ages")
print(df.head())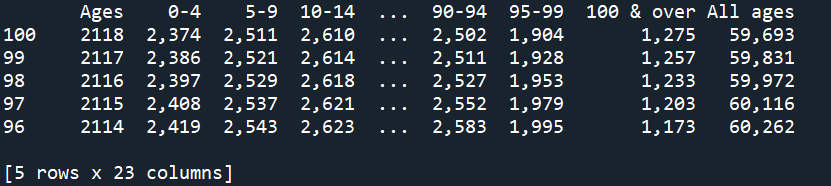
Descending
The ordering can be either ascending or descending with ascending = True being the default.
import pandas as pd

df = pd.read_csv("datafeed/population_age_structure_uk.csv")
df = df.sort_values("All ages", ascending = False)
print(df.head())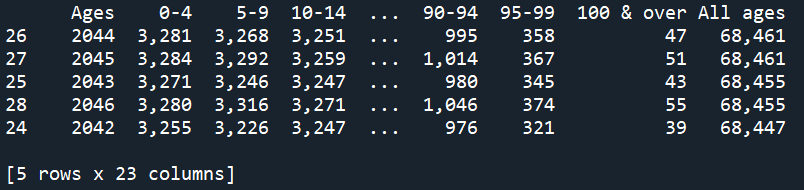
Sorting Multiple Columns
Multiple columns can be sorted depending on their argument order. Ensure to use the double brackets or the comma won’t work. The type of sort can then be controlled by inputting a boolean list
import pandas as pd

df = pd.read_csv("datafeed/population_age_structure_uk.csv")
df = df.sort_values(["0-4", "95-99"] ascending = [True, False])
print(df.head())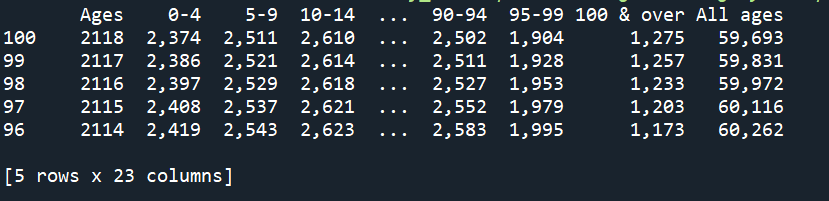
Section 5 - Subsetting Data
Subsetting Columns
By Key
Different columns can be selected by using the code below:
import pandas as pd

df = pd.read_csv("datafeed/population_age_structure_uk.csv")
df_over_hundred = df["100 & over"]
print(df_over_hundred.head())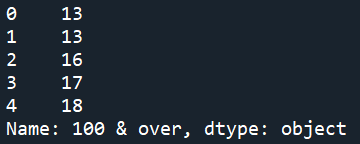
By Variables
If the heading of the columns follow the basic python variable naming rules. The columns can also be accessed as a variable.
import pandas as pd

df = pd.read_csv("datafeed/population_age_structure_uk.csv")
df = df.all_ages
print(df)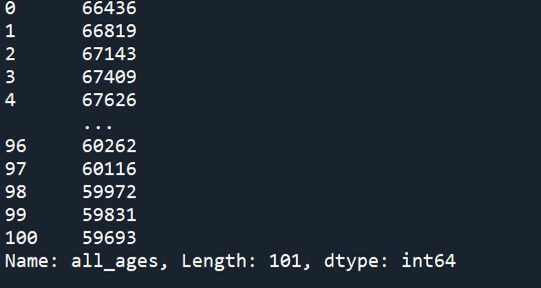
Subsetting Multiple Columns (By Name)
Multiple columns can be subset as shown:
import pandas as pd

df = pd.read_csv("datafeed/population_age_structure_uk.csv")
df = df[["100 & over", "All ages"]]
print(df.head())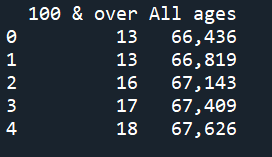
Subsetting Multiple Columns (By Index)
Columns can also be selected using the index location method and list slicing:
import pandas as pd

df = pd.read_csv("datafeed/population_age_structure_uk.csv")
df = df.iloc[:,0:3]
print(df.head())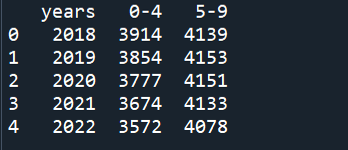
Using Relational Operators
The DataFrame can be filtered by using a relational operator to return True or False for each row and pass that inside square brackets as shown.
import pandas as pd

df = pd.read_csv("datafeed/population_age_structure_uk.csv")
df = df[(df["100 & over"] > 200) & (df["5-9"] < 3000)]
print(df.head())
Using isin
Instead of using the “or” operator (|) to select multple rows. The isin() method allows only one condition to be writen instead of multiple.
import pandas as pd

df = pd.read_csv("datafeed/population_age_structure_uk.csv")

next_five_years = [2023, 2023, 2024, 2025, 2026]

df = df[df["Ages"].isin(next_five_years)]
print(df)
Relational Operators by Variables
import pandas as pd

df = pd.read_csv("datafeed/population_age_structure_uk.csv")
df = df[(df.all_ages > 65000) & (df.years >2070)]
print(df)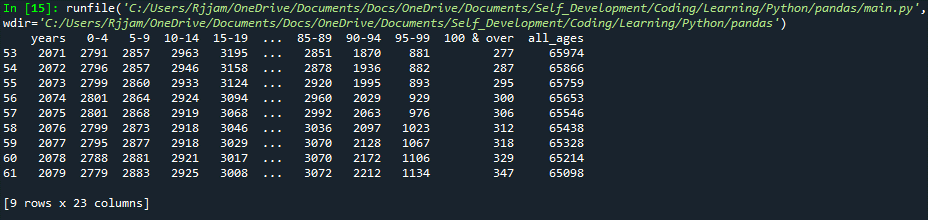
Subsetting Rows
By Row Number
You can select a single row using iloc.
import pandas as pd

df = pd.read_csv("datafeed/population_age_structure_uk.csv")
current_year = df.iloc[4]
print(current_year.head())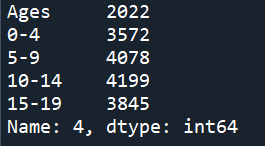
Subsetting Multiple Rows
You can select multiple rows through list splicing.
import pandas as pd

df = pd.read_csv("datafeed/population_age_structure_uk.csv")
past_to_current_year = df.iloc[:4]
print(past_to_current_year.head())
Resetting Indexes
When different rows are being selected the indexes can be out of order. To reset the indices use the reset_index() function.
import pandas as pd

df = pd.read_csv("datafeed/population_age_structure_uk.csv")
df = df.iloc[[2, 4, 6]]
print(df)
df = df.reset_index()
print(df)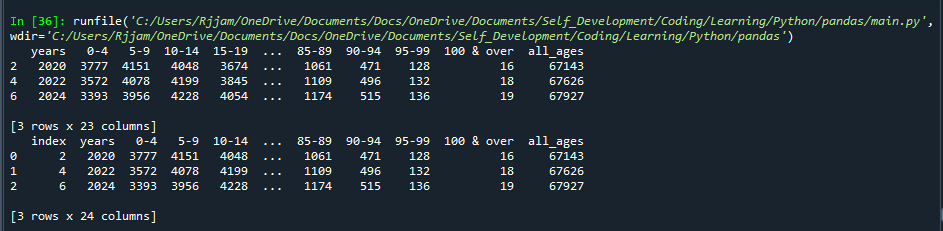
Resetting Indexes Inplace
The inplace and drop arguments can also be used to reorder and remove all other data from the DataFrame itself without needing to assign the result.
import pandas as pd

df = pd.read_csv("datafeed/population_age_structure_uk.csv")
df = df.iloc[[2, 4, 6]]
print(df)
df.reset_index(inplace = True, drop = True)
print(df)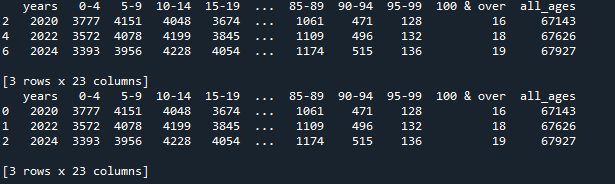
Section 6 - Modifying DataFrames
Manual Column Creation
A new column can be added to the DataFrame by inserting a new list with matching length to the existing dataframe
import pandas as pd

df = pd.read_csv("datafeed/population_age_structure_uk.csv")
df = df.head(2)

df["New Column"] = ["New", "New"]
print(df)
Blanket Column Creation
When a list is not used. All values in the new column will be equal to the value on the right.
import pandas as pd

df = pd.read_csv("datafeed/population_age_structure_uk.csv")
df["Valid"] = True
print(df)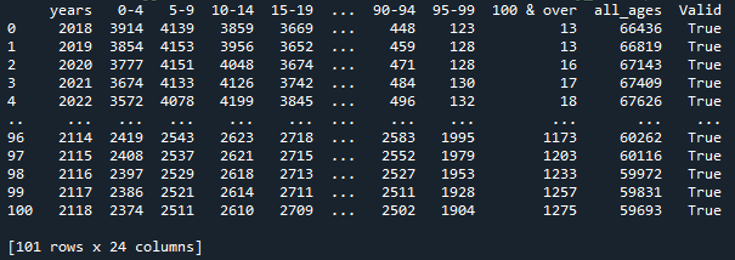
Using Existing Data
Often the values in the new table will be based on data in existing columns
import pandas as pd

df = pd.read_csv("datafeed/population_age_structure_uk.csv")
df["All Ages (in millions)"] = df["All ages"] * 1000
print(df.head())
Column Operations (apply)
The apply function can be used to modify all entries in a DataFrame or Series. It applies any function to the values. For instance it can take a column entries as shown below:
import pandas as pd

df = pd.read_csv("datafeed/population_age_structure_uk.csv")
df["New Column] = "Yes
print(df.head())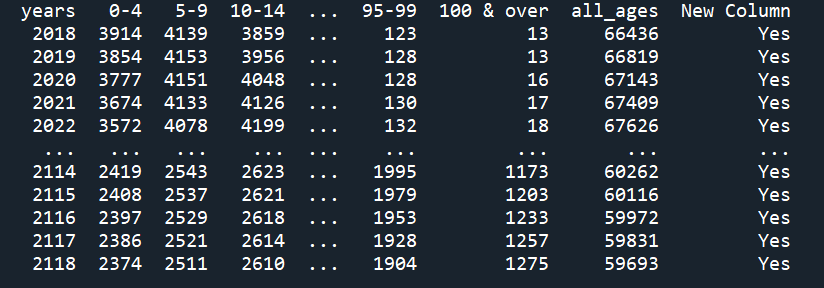
and use the str.lower function to make them lowercase.
import pandas as pd

df = pd.read_csv("datafeed/population_age_structure_uk.csv")
df["New Column] = "df[New Column"].apply(str.lower
print(df.head())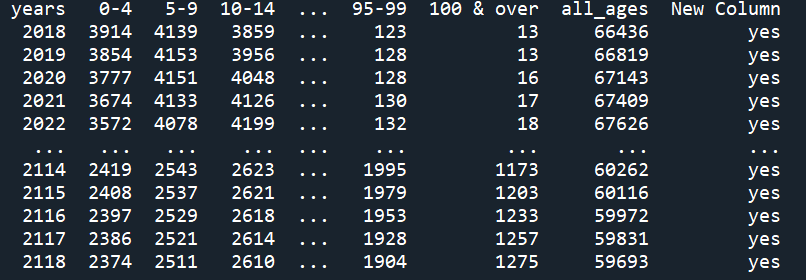
Lambda Functions
Lambda functions are small anonymous function with one expression. They can be used to apply different rules to the data within the DataFrame. In general the syntax for an “if” statement in a lambda function is: lambda x: [OUTCOME IF TRUE] if [CONDITIONAL] else [OUTCOME IF FALSE].
Examples can be seen below
Lambda Functions On Columns
import pandas as pd

df = pd.read_csv("datafeed/population_age_structure_uk.csv")
df["Predictions"] = df.["years"].apply(lambda x True if x > 2022 else False)
print(df.head(10))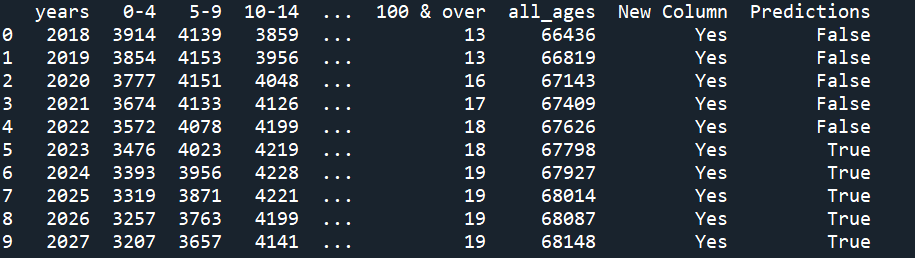
Lambda Functions On Rows
Lambda expressions can also be used to evaluate rows using the axis = 1 argument when applying the lambda
import pandas as pd

df = pd.read_csv("datafeed/population_age_structure_uk.csv")

#Lambda Expression On Columns
df["check"] = df["0-4"].apply(lambda x: True if x > 3600 else False)

#Row Lambda Expression
under_twenty = lambda row: (row["0-4"] + row["5-9"] + row["10-14"] + row["15-19"]) if row["check"] == True else None

#Applying Row Lambda Expression to create new column
df["under_twenty"] = df.apply(under_twenty, axis = 1)

#Printing Columns Affected
df2 = df.iloc[:, 0:5]
df2["under_twenty"] = df["under_twenty"]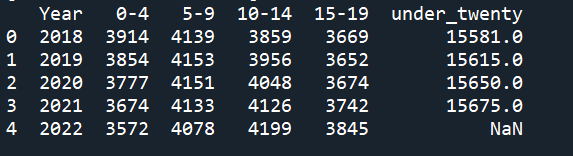
Renaming Columns
When obtaining data from other sources, sometimes it will be good to change the column names. For example, to reference the columns using variable rules such that “df.column_name” can be used instead of df[“column_name”]. All columns can be changed at once by setting the column property to another list. However, this isn’t recommended as its easy to mislabel.
See below:
import pandas as pd

df = pd.read_csv("datafeed/population_age_structure_uk.csv")

df = df.iloc[:,:3]
df.columns = ["Years", "Baby", "Young Child"]
print(df)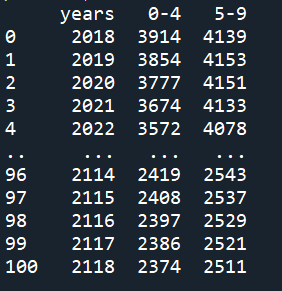
Using The rename Function
The better way to rename is to use the rename function which uses a dictionary with the original column name as the key, and the new one as the value. That way if the current name isn’t exact. Nothing will be changed.
import pandas as pd

df = pd.read_csv("datafeed/population_age_structure_uk.csv")

df = df.iloc[:,:3]
df.rename(columns = {"years": "Year", inplace = True)
print(df)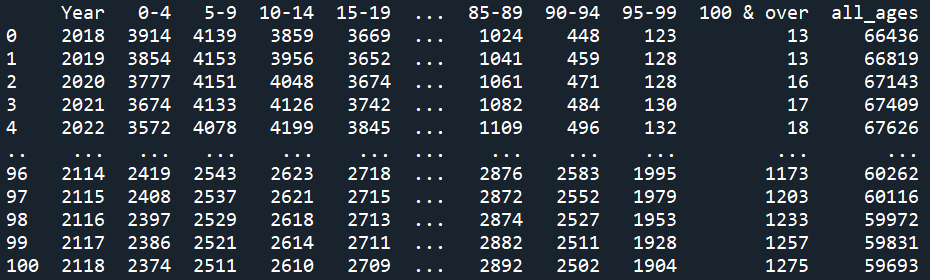
Section 7 - Aggregates
Aggregate functions summarize many data points (i.e., a column of a dataframe) into a smaller set of values. They follow the syntax “df.column_name.command()”. See the table below for examples.
| Function | Description |
|---|---|
| .mean() | Average of all values in column |
| .std() | Standard Deviation |
| .median() | Median |
| .max() | Maximum value in column |
| .min() | Minimum value in column |
| .count() | Number of values in column |
| .nunique() | Number of unique values in column |
| .unique() | List of unique values in column |
See below for usage.
import pandas as pd

df = pd.read_csv("datafeed/population_age_structure_uk.csv")

print(df["0-4"].max())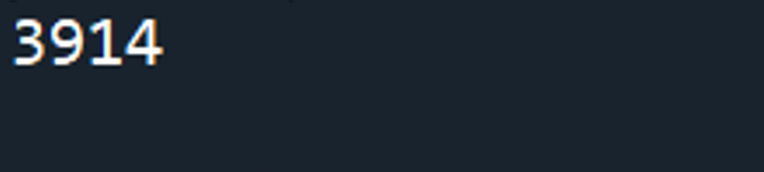
Group By
The groupby operation involves some combination of splitting the object, applying a function, and combining the results. This can be used to group large amounts of data and compute operations on these groups.
This next section will interrogate the data shown below
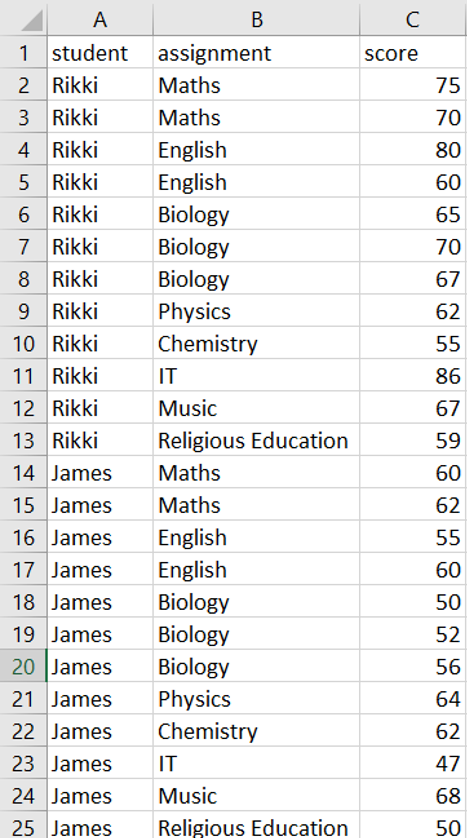
To calculate the mean score of each student the following code can be used:
import pandas as pd

df = pd.read_csv("datafeed/grades.csv")

averages = df.groupby("student").score.mean()
print(averages)
print(type(averages))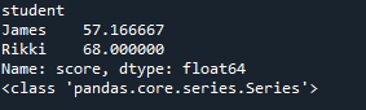
The result of the code above is a Series. To keep it as a DataFrame - use the reset_index() function. The name of each column could also be used to keep each column up to data.
import pandas as pd

df = pd.read_csv("datafeed/grades.csv")

averages = df.groupby("student").score.mean().reset_index()
averages.rename(columns = {"score": "average_score"}, inplace = True)
print(averages)
print(type(averages))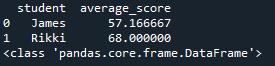
Group By (Using Lambdas)
Grouping can also be done with customisable lambda expressions
import pandas as pd
import numpy as np

df = pd.read_csv("datafeed/grades.csv")

#Calculates 75 percentile
high_grade = df.groupby("student").score.apply(lambda x: np.percentile(x,75)).reset_index()
print(high_grade)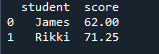
Group By (Multiple Columns)
Multiple columns can be grouped using a list as an argument in the groupby function.
import pandas as pd


df = pd.read_csv("datafeed/grades.csv")

subjects = df.groupby(["assignment","student"]).score.mean().reset_index()
print(subjects)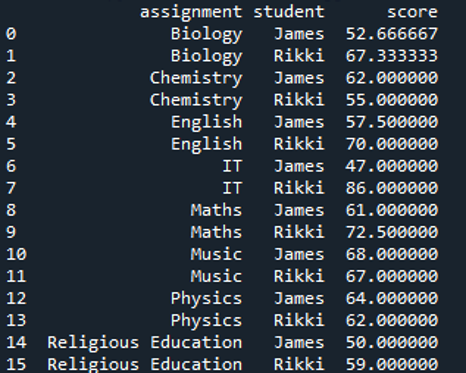
Pivot Tables
In Pandas, tables output can be modified to change the layout using pivot tables.
import pandas as pd


df = pd.read_csv("datafeed/grades.csv")

subjects = df.groupby(["assignment","student"]).score.mean().reset_index()
subjects_pivot = subjects.pivot(columns = "assignment", index = "student", values = "score").reset_index()
print(subjects_pivot)